Life Cycle Analysis of a hydrogen-fuelled ICE passenger car
Published on 19 February 2022
Hydrogen-fuelled vehicles are among the proposed technologies for a zero-emission transport sector. Yet, the zero-emission label only considers emissions during vehicle travel, not the complete life cycle.
Present article is a contribution to the Life Cycle Analysis of hydrogen-fuelled vehicles and compares this technology to existing gasoline-fuelled vehicles as well as battery electric vehicles (an alternative solution for a zero-emission transport sector).
The analysis details the various categories of greenhouse gas emissions over the life cycle of a vehicle:
- Manufacturing of the vehicle (excluding the energy storage device)
- Manufacturing of the energy storage device
- Production, conditioning and distribution of the energy
- Emissions during vehicle travel
The reference vehicles for conventional and battery-electric options are a Volvo XC40 and a Polestar 2. These are commercially available vehicles for which a complete Life Cycle Analysis has been published by their respective manufacturers. The hydrogen-fuelled vehicle is a derivative of the Volvo XC40 (hydrogen-fuelled internal combustion engine), with tanks similar to a Toyota Mirai, thereby avoiding the introduction of numerous hypotheses.
The following sections compare vehicles for each category listed above and then highlight the central influence of vehicle mileage on conclusions about vehicle ecofriendliness.
Carbon footprint of the vehicle excluding its energy storage device
The Life Cycle Analysis published by Polestar in collaboration with Volvo provides detailed information about the environmental impact of producing either a gasoline-fuelled Volvo XC40 or a battery-electric Polestar 2. This publication further splits the required resources for the Polestar 2 between the lithium-ion battery and the rest of the vehicle, which is key for understanding differences between technologies.
It is worth noting that a comparison of a Volvo XC40 with a Polestar 2 is fair in terms of market placement: they are both premium vehicles of similar vehicle class, size and "shell" weight (weight excluding the energy storage device).
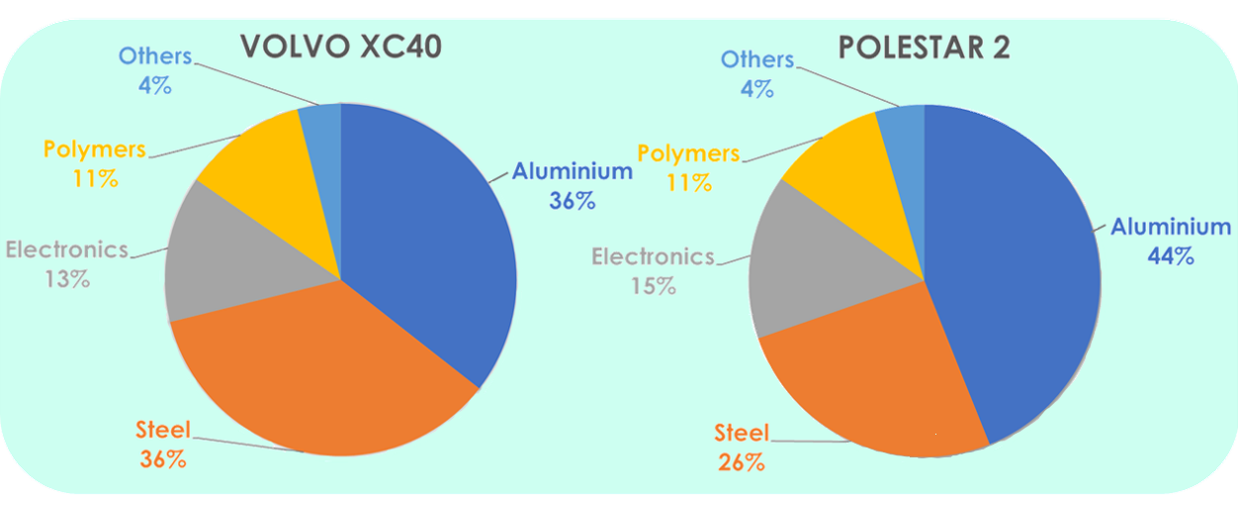
Material carbon footprint for the "shell" of a Volvo XC40 and a Polestar 2
The published data notably provide a breakdown of the vehicle carbon footprints in relation to the various classes of materials. For the shell, both vehicles have reasonably similar total carbon footprints: 17 tons of CO2,eq for Polestar 2 and 14 tons of CO2,eq for Volvo XC40. The split into materials shows that the Polestar 2 relies more heavily on aluminium parts than the Volvo XC40. It appears that aluminium is displacing steel, most likely in the vehicle chassis. On top of material-related emissions, there are also manufacturing emissions: 2.2 tons of CO2,eq for Polestar 2 and 2.1 tons of CO2,eq for Volvo XC40.
The hypothetical hydrogen-fuelled passenger car is a Volvo XC40 converted to hydrogen fuelling by updating the injection system and swapping the gasoline fuel tank for a hydrogen Type IV tank. No changes to the Volvo chassis are included and the adaptation of the internal combustion engine is restricted to the fuelling system. Accordingly, the shell of the hydrogen-fuelled vehicle has the same carbon footprint as the gasoline-fuelled vehicle (remember that fuel tanks are excluded in this section).
Carbon footprint of the vehicle energy storage device
Gasoline-fuelled Volvo XC40s are equipped with a polymer 54L fuel tank. Based on the analysis of Dlamini et al.[1], we can estimate that the production of such a tank has a carbon footprint of ~16 kgCO2,eq, the production of the high-density polymer being the main contributor.
Converting a Volvo XC40 to hydrogen fuelling while keeping an internal combustion engine requires the addition of a hydrogen fuel tank. A Type IV tank with a capacity of 5 kg of hydrogen (same as a Toyota Mirai MY2020) would provide a decent vehicle range. The Life Cycle Analysis of Type IV tanks indicates that the production of such a tank has a carbon footprint of ~1.1 tons of CO2,eq. The production of the carbon fibre is by far the main contributor to this carbon footprint, so that progress on carbon fibre production could bring future improvement in Type IV tank environmental impact.
The Life Cycle Assessment of the Polestar 2 indicates that the carbon footprint of the production of its 78 kWh battery is 7 tons of CO2,eq. Unfortunately, the publication does not detail which part or process is (are) the main contributor(s).
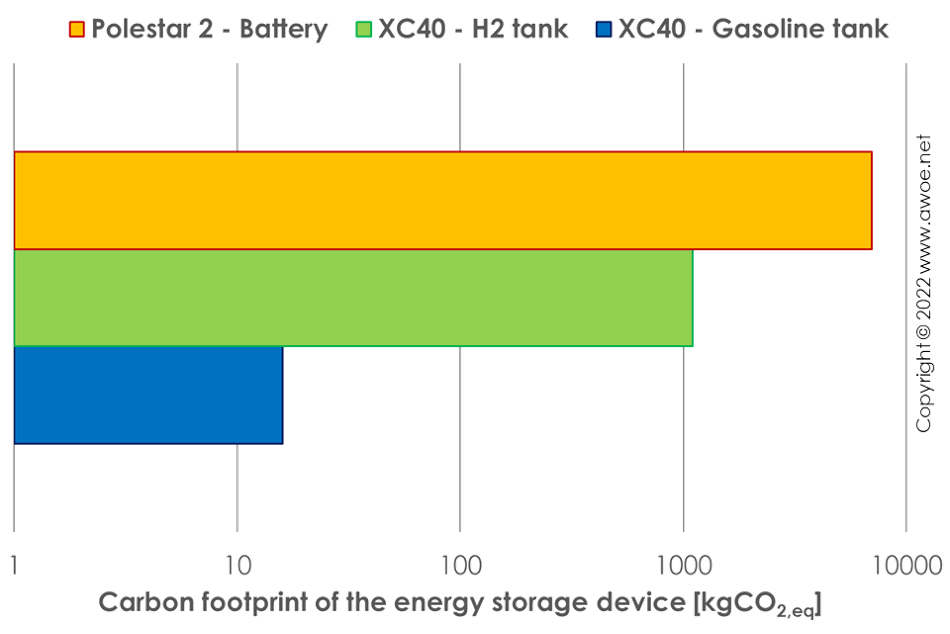
Comparison of carbon footprint of various on-board energy storage technologies (logarithmic scale)
There is a large difference between technologies on the energy storage device with tanks for liquid fuels (gasoline here) having the lowest environmental impact. The energy storage device for hydrogen appears to have a lower environmental impact than a vehicle battery.
Energy production, conditioning and distribution
Eriksson and Ahlgren[2] performed a literature review of the environmental impact of crude-based fuels, providing an insight into the carbon footprint of extracting, refining and distributing gasoline. They identified 8 sources quantifying this impact and established a range of 6.7-18.5 gCO2,eq/MJ for all operations from well to tank, with most studies very close to the average of 12.1 gCO2,eq/MJ. With an average CO2 rating of 163 gCO2,eq/km for gasoline-fuelled XC40s, their rated energy consumption is 2.22 MJ/km and the carbon footprint of all well-to-tank operations is 26.9 gCO2,eq/km.
Converting a gasoline-fuelled engine to hydrogen fuelling should bring some efficiency benefits. However, studies quantifying such a benefit do not reach a clear common view and most includes some engine modifications past the change of fuel to maximise efficiency gains. To be conservative, we therefore chose in the present analysis to consider that the hydrogen-fuelled engine has the same efficiency as its gasoline-fuelled counterpart. Consequently, we assumed that the average vehicle energy consumption is also 2.22 MJ/km with hydrogen.
The Life Cycle Analysis of hydrogen production through alkaline electrolysis indicates a predominance of electricity consumption on its carbon footprint. The electric consumption of a state-of-the-art alkaline electrolysis plant is ~60 kWh/kgH2. In addition to the electric consumption, the construction and maintenance of the electrolysis plant also includes a minimum carbon footprint of 86 gCO2,eq/kgH2, equivalent to 1.59 gCO2,eq/km for a vehicle with an energy consumption of 2.22 MJ/km. The conversion of the electric consumption into equivalent CO2 emissions is highly dependent on the location of the electrolysis plant and therefore the country (or even region) in which the vehicle is operated (see below).
Hydrogen being a very light gas, it is never stored at ambient conditions. Because we assumed a Toyota-Mirai-like Type IV tank in the vehicle, a compression step between electrolysis and vehicle fuelling is required. The Life Cycle Analysis of hydrogen compression quantifies the environmental impact of this step in the fuel distribution. The hydrogen compression up to 900 bar (to feed a tank at 700 bar) from a pressure of 15 bar at electrolysis outlet can be obtained for an electricity consumption of ~3 kWh/kgH2. Similarly to electrolysis, there is also an environmental impact from building and maintaining the compression plant, which can be as low as 5 gCO2,eq/kgH2 (or 0.09 gCO2,eq/km for a vehicle with an energy consumption of 2.22 MJ/km). Once again, the greenhouse gas emissions related to electric consumption depend on the plant location (see below).
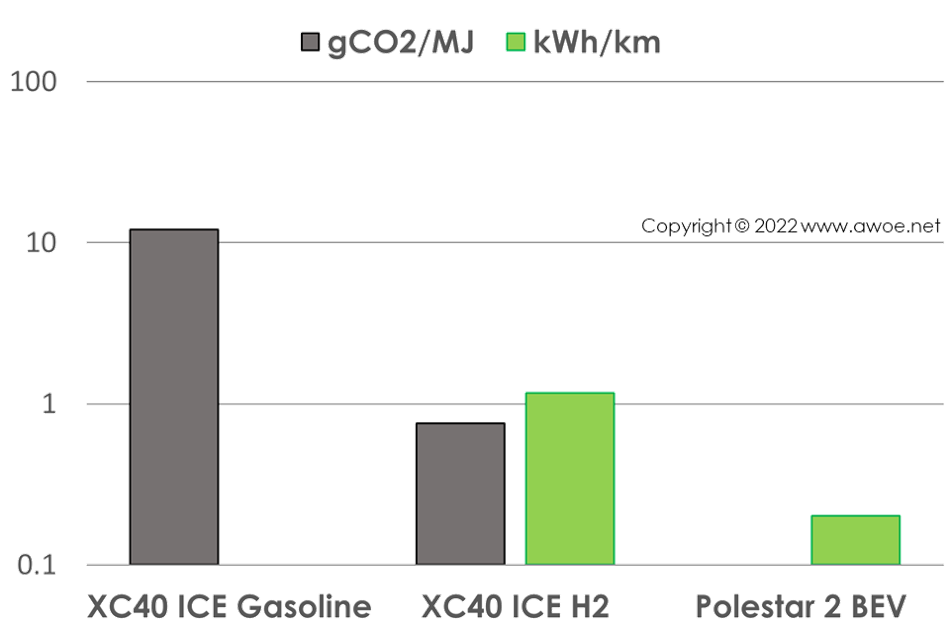
Comparison of carbon footprint and electricity demand for vehicle energy production and conditioning (logarithmic scale)
A battery electric vehicle does only consumes electricity and therefore has no emissions related to energy extraction or conditioning. Yet, the distribution of electricty across the transmission grid implies losses.
While losses on the high-voltage industrial network (those impacting an electrolyser) are relatively low, the transmission and distribution through the low-voltage network is a lot less efficient. These losses are mainly related to voltage conversion from high voltage (>100,000 V) to low voltage (<1,000 V) as well as energy routing in substations. The Life Cycle Assessments[3,4] published by the International Council on Large Electric Systems concludes that, on average, the energy losses between electricity production and local consumption is about 10%.
The electricity consumption rating of the Polestar 2 is 0.202 kWh/km. Accounting for a 10% average loss across the distribution grid means an electricity consumption of ~0.222 kWh/km from the point of view of the electricity producer. Once again, the conversion of this electricity consumption into equivalent CO2 emissions depends on the method for electricity production (see below).
Emissions during vehicle travel
Emissions of greenhouse gases during vehicle travel is the key difference between the conventional gasoline-fuelled vehicle and the alternative approaches. The hydrogen-fuelled engine only releases water vapour and nitrogen oxides (at a low concentration to conform to emission legislations) at the exhaust, while the battery electric vehicle has no gaseous emissions at all.
As indicated earlier, the rated CO2 emissions of the fleet-averaged Volvo XC40 is 163 gCO2/km. This large drawback in emissions during use comes at a balance for the large advantage in emissions from the energy storage device manufacturing. Accordingly, we should expect a crossing point past which the alternative approaches have a lower environmental impact than the conventional one.
Yet, because a large part of the emissions from the alternative propulsion solutions are related to the carbon footprint of electricity, the location of vehicle use has an influence on the crossing point.
Influence of vehicle use location through electricity carbon footprint
While the environmental impact of a gasoline-fuelled vehicle is the same anywhere, the ecofriendliness of the alternative methods depends on the local electricity carbon footprint.
To quantify this influence, we compared vehicle operation for a low carbon footprint and for a moderately high carbon footprint. We chose Sweden as a reference for a low carbon footprint (average electricity carbon footprint of 12 gCO2,eq/kWh in 2019) and the complete European Union as a reference for a moderately high carbon footprint (average electricity footprint of 255 gCO2,eq/kWh in 2019). This is considered moderately high because some countries like Germany and Poland have significantly higher electricity carbon footprint, defining a very high level.
Beyond the electricity carbon footprint, a total mileage for the vehicle life cycle is also required to compare initial emissions from manufacturing with usage emissions for energy production as well as emissions during travel. The European Union official statistics indicate an average mileage of 15,000 km per year per vehicle and an average life of 10.9 years for each vehicle, roughly giving a total mileage of 160,000 km.
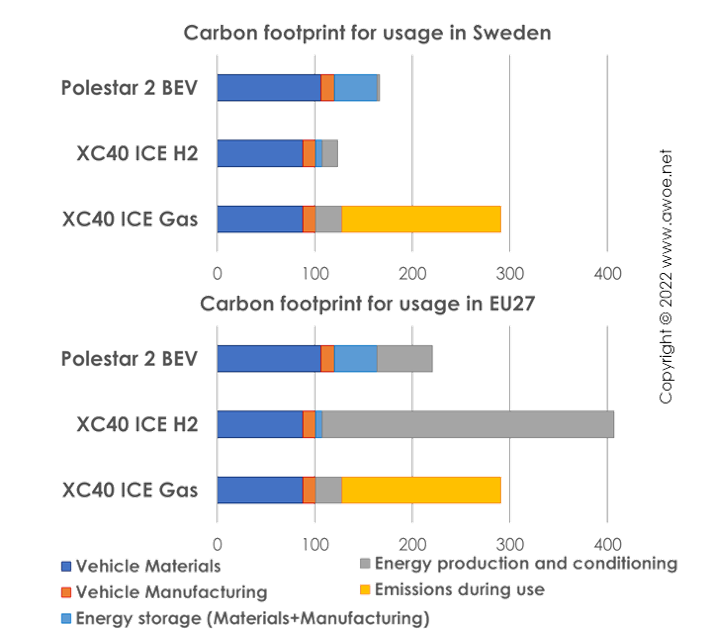
Comparison of vehicle carbon footprint over a complete life cycle for 2 different electricity carbon footprint
All previous emission and electricity consumption values are converted in CO2,eq emissions per travelled kilometre based on a life cycle of 160,000 km and an electricity carbon footprint of either 12 or 255 gCO2,eq/kWh. Without much surprise, the conventional gasoline-fuelled vehicle is never the cleanest over 160,000 km. Yet, it is never the dirtiest either! When electricity is clean, a hydrogen-fuelled ICE vehicle is cleaner than a battery electric vehicle. However, dirty electricity implies that a hydrogen-fuelled ICE vehicle is even dirtier than a gasoline-fuelled ICE vehicle.
The competition between the battery-electric vehicle and the hydrogen-fuelled vehicle depends on the relative weight of the initial manufacturing emissions for the energy storage device and of the electricity carbon footprint. Producing a battery has a larger environmental impact than producing a hydrogen tank. But converting electricity into hydrogen includes large losses, leveraging the electricity carbon footprint by a factor of at least 2.
Influence of vehicle mileage at end of life
An alternative approach to analyse the various propulsion technologies is to look at the evolution of their specific greenhouse gas emissions with end-of-life mileage. Whatever the vehicle type, the initial manufacturing has a large environmental impact, so that increasing the end-of-life mileage always reduces the specific greenhouse gas emissions. Yet, because of emissions during energy production and conditioning as well as of emissions during travel, not all technologies experience the same specific emission decay.
Considering the case of a clean electricity grid (Sweden), the hydrogen vehicle is always the best solution. At the vehicle manufacturing stage, it is far better than the battery electric vehicle because of the environmental burden of battery manufacturing. In addition, the production of a Type IV tank has a lower carbon footprint than burning gasoline as soon as the vehicle travels 7,000 km.
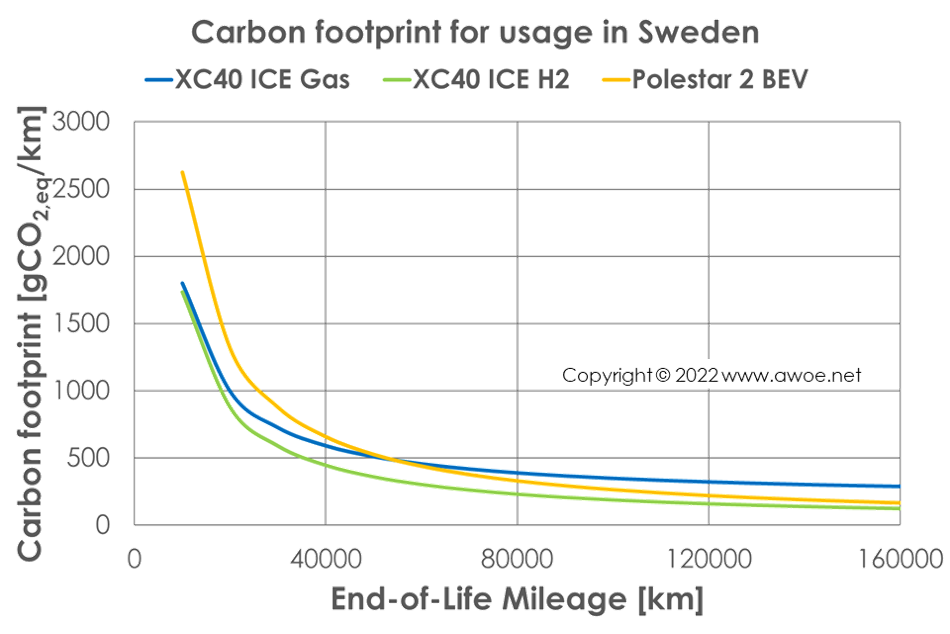
Influence of end-of-life mileage on vehicle carbon footprint in Sweden
The battery manufacturing burden is so large that even with a clean electricity supply, the battery electric vehicle only becomes a more environmentally-friendly solution than a gasoline-fuelled ICE vehicle past 54,000 km. Despite the inefficiency of producing hydrogen from electricity, the battery electric vehicle only converges towards the carbon footprint of the hydrogen-fuelled vehicle for a mileage of 700,000 km, an unlikely total mileage for any of these technologies.
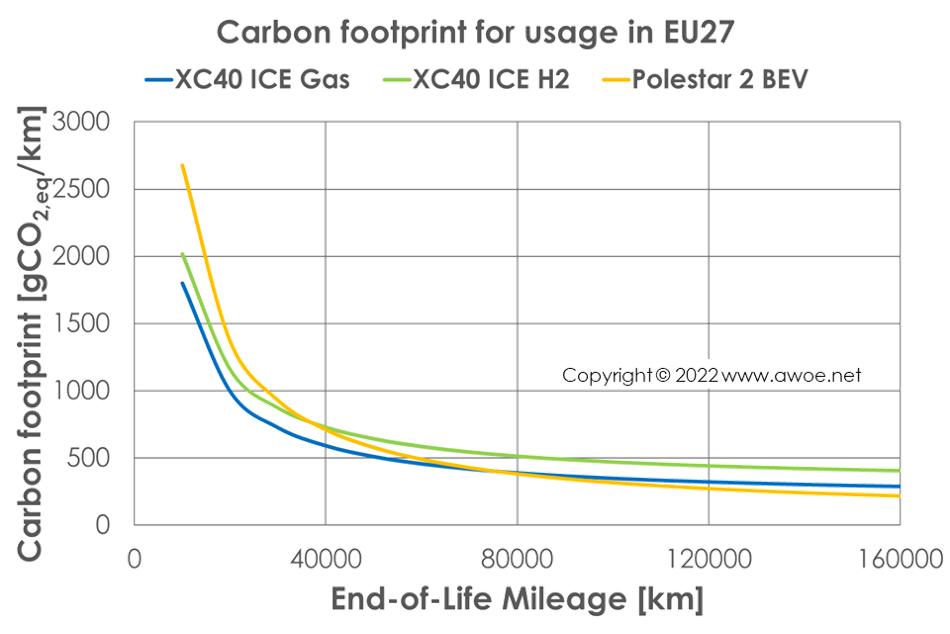
Influence of end-of-life mileage on vehicle carbon footprint in the European Union
When only dirty electricity is available, the hydrogen-fuelled vehicle is always the worst solution. Furthermore, as long as total mileage is below 75,000 km, burning gasoline in an ICE vehicle is cleaner than running a battery electric vehicle. Accordingly, there is no single technological solution that provides the cleanest transportation solution in all conditions.
References
[1] Dlamini et al., The environmental LCA of steel vs HDPE car fuel tanks with varied pollution control, International Journal of Life Cycle Assessment, 16 (2011), 410-419
[2] Eriksson and Ahlgren, LCAs of petrol and Diesel - a literature review, Swedish University of Agricultural Science, Report 2013:058
[3] Cigré, Life Cycle Assessment (LCA) for overhead lines, International Council on Large Electric Systems (Cigré), Paris
[4] Cigré, Electrical power supply using SF6 technology, International Council on Large Electric Systems (Cigré), Paris